Key takeaways
- ✓Every WER has noise: which clips you picked, run-to-run randomness, the network. If a change is smaller than the noise, one run can't decide it.
- ✓Use the bootstrap for error bars on WER, and resample speakers, not clips: 300 clips were worth about 186 independent ones.
- ✓Compare models with a paired test on the same clips. It's about twice as sensitive as checking whether two intervals overlap.
- ✓"Can't tell" is a real answer. A 1.4-point "improvement" from one run on 100 clips didn't replicate on 300.
- ✓Run A/A tests on your gate, and know its power: with 300 clips, +1 point is caught every time, +0.5 only two times in three.
Chapter 1 ended with a warning: a new model version looked 1.4 points better, better on 14 clips and worse on 6. That's the kind of result that gets announced as "30% fewer errors". This chapter is about whether it's real.
Where the noise comes from
Every WER you measure carries noise from several places at once:
| Source | Example | What it affects |
|---|---|---|
| Sampling | Which clips and speakers happen to be in the test set | Every metric, always |
| Nondeterminism | The same API model gave a different transcript for ~15% of clips on a re-run | API models (and, slightly, local ones) |
| Infrastructure | The network, the provider's load | Latency above all |
| The test itself | Reference errors, normalizer versions (Chapters 1–2) | Absolute numbers |
A release decision compares two numbers, and each carries this noise. If the difference is smaller than the noise, one run can't decide it.
Error bars with the bootstrap
Corpus WER is a ratio of two sums, so there's no simple formula for its error bars. The bootstrap gets them by resampling: draw 300 clips with replacement from the 300 you have, compute corpus WER, and repeat thousands of times. The middle 95% of those values is the 95% confidence interval.
Each bar is one of 2,000 resampled test sets: draw 100 clips with replacement and recompute WER. The green band is the middle 95%. Try resampling by speaker.
In the lab, whisper-small.en scored 4.42% on 300 clips, with an interval of 3.52–5.42%. The textbook formula, which treats every word as an independent coin flip, claimed ±0.56; the bootstrap says ±0.95. Errors come in clumps, and the formula misses that.
Two things change the width:
- Test-set size. ±3.65 points at 25 clips, ±1.35 at 100, ±0.97 at 300. Drawing 1,000 different 100-clip test sets, the same model scored anywhere from 2.65% to 6.38%. Chapter 1's leaderboard had models less than a point apart.
- Speakers. Clips from one speaker aren't independent: if a speaker is hard, all their clips are hard. Resampling whole speakers (the cluster bootstrap) widened the interval to ±1.21 points. That's honest, because a new test set would have new speakers. The 300 clips were worth about 186 independent ones.
Pair your comparisons
To compare model A with model B, don't check whether their two intervals overlap. Both models ran on the same clips, and a clip that's hard for one is usually hard for the other. Look at the per-clip differences instead, where that shared difficulty cancels out: a paired bootstrap resamples the same clips for both models and computes the change each time. If its 95% interval excludes zero, the change is real.
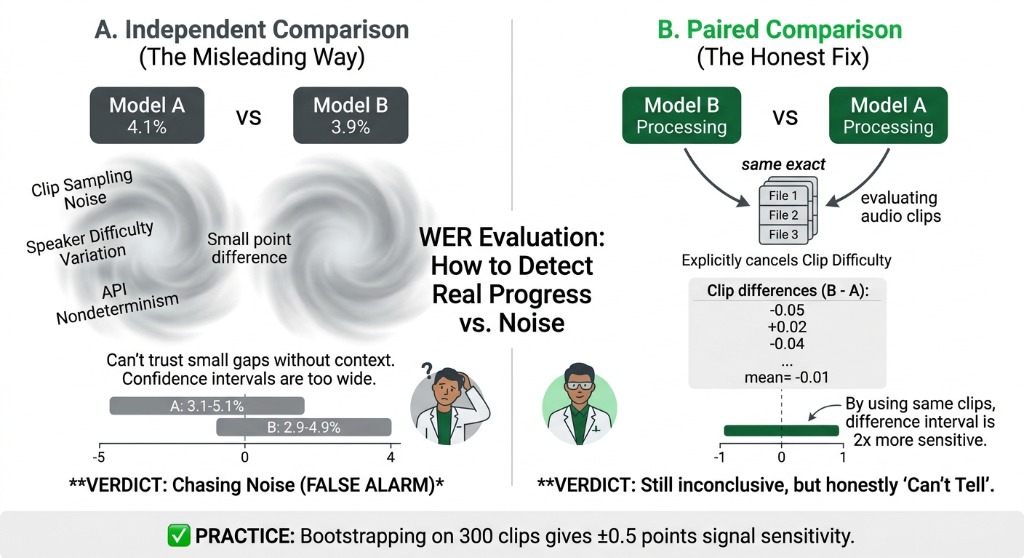 Independent comparison vs. paired comparison — evaluating on the same clips cancels shared difficulty.
WER 3.16% → 3.10% · change -0.06 points
? can't tellThe bar is the 95% interval of the change from a paired bootstrap: resample the same speakers for both models. It crosses zero, so this test set can't tell them apart.
Here is what happened to Chapter 1's "improvement". The two versions scored 3.16% and 3.10% on 300 clips. Paired change: −0.06 points (95% CI −0.57 to +0.45). Each version was better on exactly 26 clips, with 248 ties. Verdict: can't tell.
The −1.39 from Chapter 1 came mostly from two clips where the old version randomly switched to German and Portuguese. That's a real difference in how often each version switches language, but it's a rare-failure rate to measure the Chapter 3 way, not a WER improvement.
A result is better, worse, or can't tell, and "can't tell" is a real and common answer. When a product manager asks "so is the new version better?", the honest reply sounds like: "No detectable difference in WER on 300 clips, ±0.5 points. It is 15% faster. If a smaller WER change matters, here's how many clips it would take."
Test your gate with A/A tests
Compare a model with itself: two runs, nothing changed. Every alarm is false by definition. In the lab, the same API model, run 5 times, scored between 2.89% and 3.20%, and each re-run changed 43–46 of the 300 transcripts.
The same model run twice, 10 pairs of runs. Every alarm is false by definition.
- Fail if WER moves > 0.05 points9/10
- Fail if WER moves > 0.1 points6/10
- Fail if WER moves > 0.2 points4/10
- Paired bootstrap: 95% interval excludes 01/10
An API model rewrote about 15% of clips on every re-run, so a fixed threshold fires on noise. One false alarm in 10 is what a 95% interval allows.
A fixed threshold like "fail if WER rises more than 0.1 points" fired on 6 of 10 A/A pairs. That trains people to click "re-run" until it passes, and then real regressions get re-run away too. The paired bootstrap fired on 1 of 10: exactly what a 95% interval allows.
The other side is power: the chance your gate catches a regression of a given size. With 300 clips, a +1-point regression was caught every time; +0.5 only two times in three; a 50-clip smoke test reliably catches only about +2 points. The detectable effect shrinks with the square root of the test-set size: four times the clips, half the effect. And real regressions are concentrated: the same +1 point hitting only 10% of clips was caught 52% of the time instead of 72%, which is why slices matter (Chapter 2).
Many slices, many false alarms
Check 50 slices at 95% confidence and about 2–3 will look significant by chance alone. In the lab, a naive rule ("worse by more than 1 point") flagged 7 speakers when nothing had changed. The fixes: choose gating slices in advance and keep them few, correct for the rest (Bonferroni, or Benjamini–Hochberg), and look for consistency, since a real regression usually shows up in related slices, not just one.
Latency needs error bars too
Report percentiles (p50, p95, p99) with intervals, and remember that the tail needs many samples: from 100 requests, the p99 interval was 0.75–1.36 s. Compare models on the same clips, because longer audio takes longer. In the lab, clip by clip, the old version took 1.15× as long as the new one (95% CI 1.14–1.17×). So the two versions differed clearly in speed while their WER difference was undetectable.
Practice: bootstrap it yourself
Implement corpus WER, the bootstrap interval, the paired bootstrap, and the verdict, in plain Python. The tests check the properties the lab relies on: the interval contains the estimate, more clips narrow it, a clear improvement is detected, a tiny change is "can't tell", and pairing beats separate intervals.
Quiz
1.A vendor reports 4.1% WER on 100 clips. Your model gets 4.6% on its own 100 clips. What can you conclude?
2.Why resample speakers instead of clips when bootstrapping WER?
3.Two model versions have overlapping 95% intervals: 3.16% (2.37–4.04%) and 3.10% (2.17–4.16%). What's the better way to compare them?
4.Your CI gate fails whenever WER rises by more than 0.1 points. The model is an API that rewrites about 15% of clips on every run. How often does it fail when nothing changed?
5.Research wants to catch a 0.3-point regression. With 300 clips, the gate reliably catches about 0.7 points. Roughly how many clips do you need?
6.You check WER on 50 customer slices and 3 look worse at p < 0.05. Is the model worse?
Check your understanding
Try each question before opening its answer.
What are the sources of noise in a speech evaluation?
Sampling, model nondeterminism, infrastructure (especially latency), and the test itself (references and normalizer versions). A comparison smaller than their combined uncertainty cannot be decided from one run.
How does the bootstrap work, and why use it for WER?
Resample evaluation units with replacement many times and recompute corpus WER to form an interval. It handles WER's ratio-of-sums structure and clustered errors better than a word-independent formula.
Why resample speakers instead of clips, and what is effective sample size?
Clips from one speaker share difficulty, so clip resampling understates uncertainty. Cluster-resample speakers; effective sample size describes how many independent observations the clustered set is worth.
Why is a paired comparison more sensitive than comparing two intervals?
Both systems share the same hard clips, so per-clip differences cancel much of that shared variation. Separate intervals include it twice and can obscure a real difference.
What's an A/A test, and what does it tell you about a gate?
Compare a system with itself across runs. Since nothing changed, alarms estimate the gate's false-alarm rate; it should match the rate the test was designed for.
How would you set a regression tolerance for a nondeterministic API model?
Measure baseline run-to-run noise, compare paired outputs on the same clips, and validate the threshold with A/A tests. Averaging multiple runs reduces noise, but a paired interval is preferable when available.
What's a minimum detectable effect, and how does test-set size change it?
It's the smallest regression a test reliably detects at its chosen power. It shrinks roughly with the square root of sample size, so about four times the data is needed to detect half-sized changes.
You check 50 slices and 3 look worse. Is the model worse?
Not necessarily: multiple comparisons produce false positives. Check whether slices were prespecified, adjust for multiple testing, inspect effect sizes and related slices, and rerun the analysis.
How do you compare latency between two models fairly?
Use the same clips and paired per-clip comparisons, interleave requests in the same time window, report percentiles with intervals, and state hardware, concurrency, network, and timing conditions.
Next up: everything so far has been batch transcription. Chapter 5 tests live, streaming speech-to-text, where the words appear before the speaker finishes.